Market Recap March 2023

Financial chart with a multicolored pie graph, bar graphs, and a blue line.


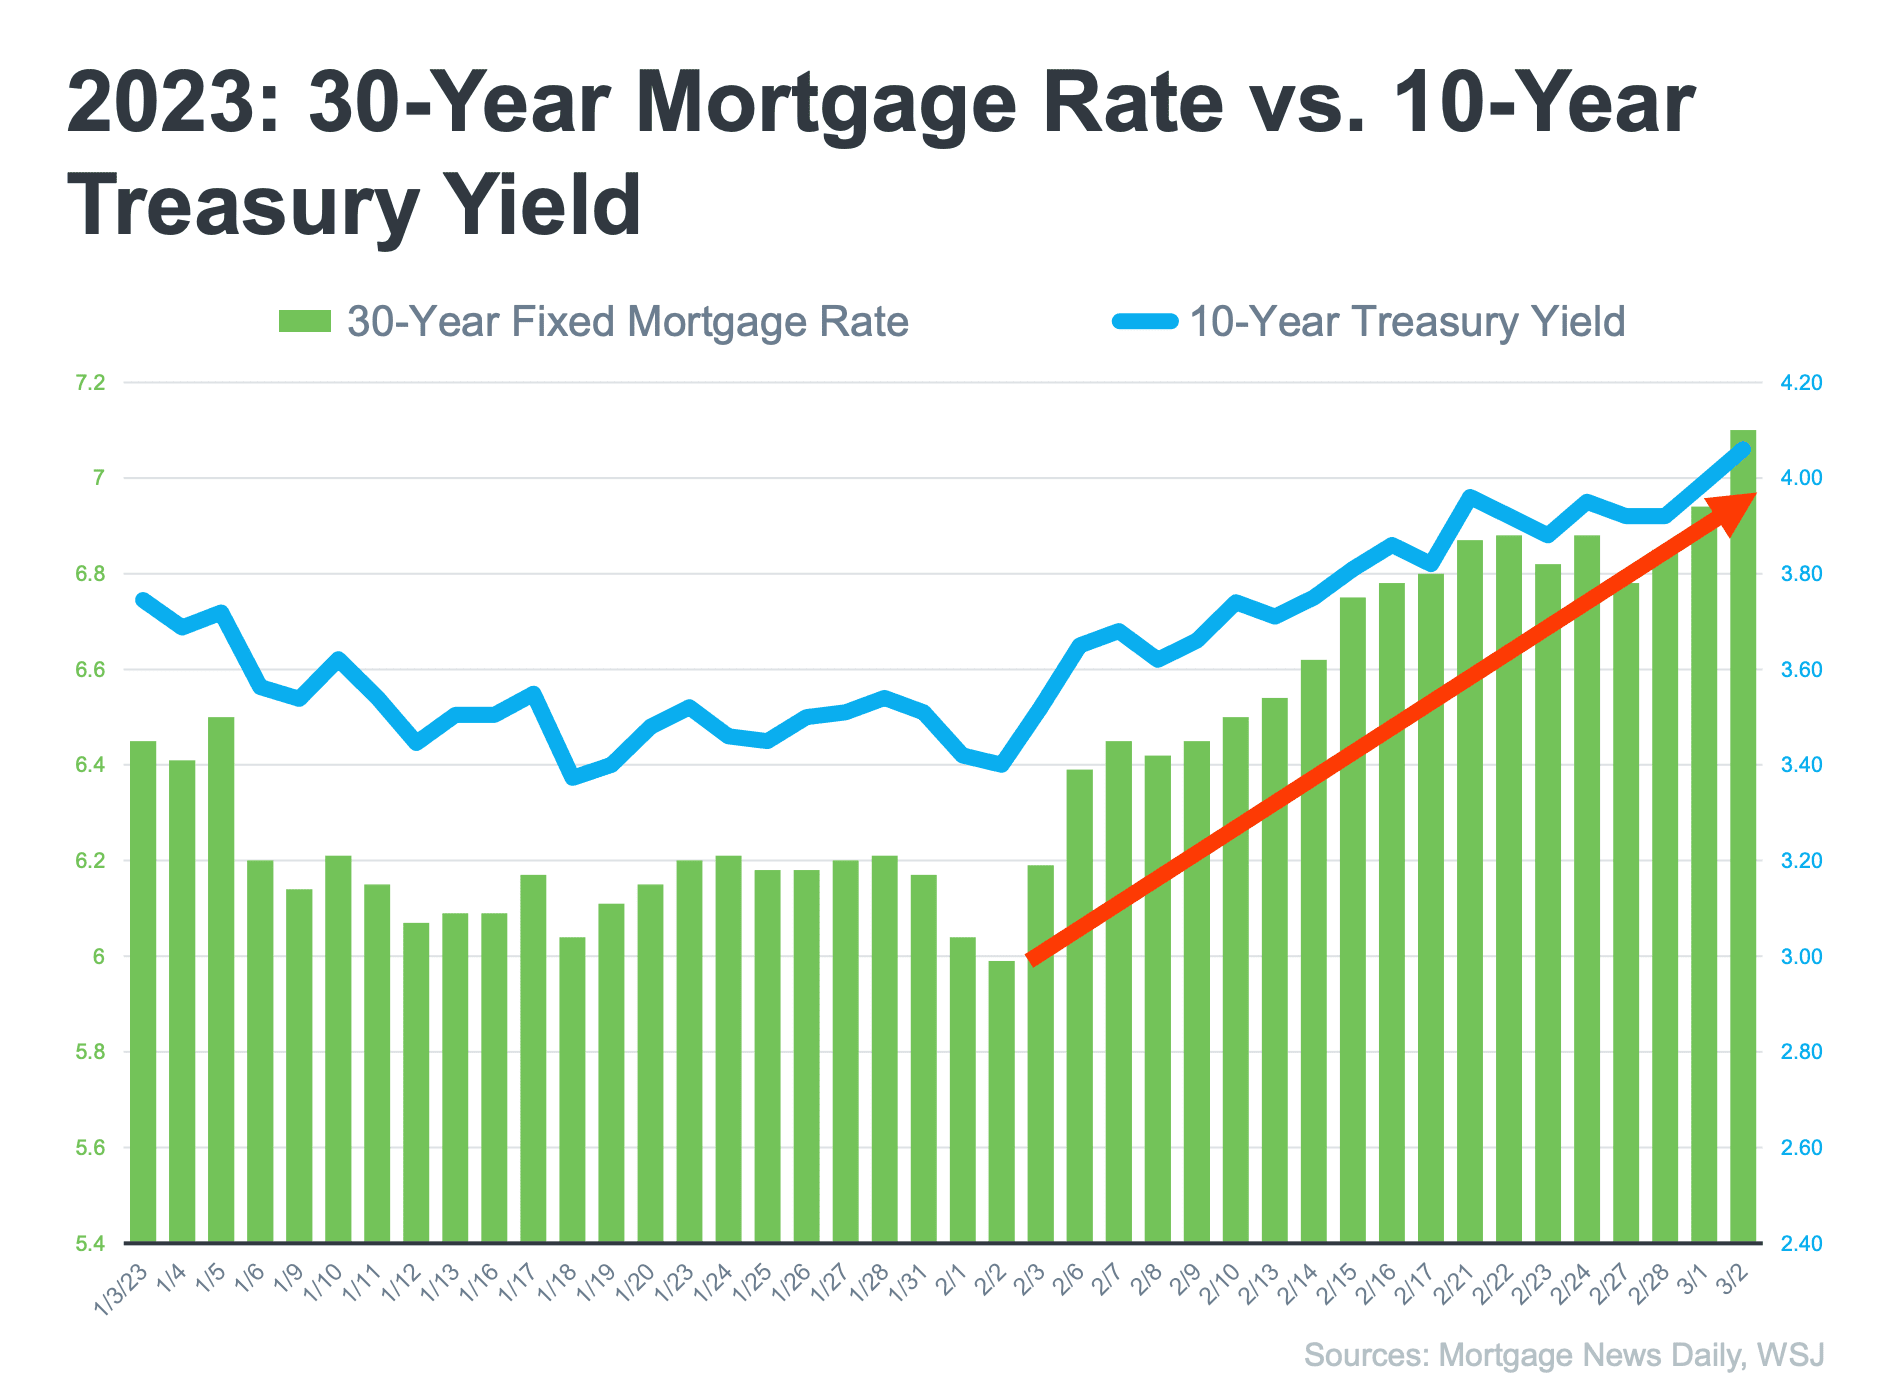
Chart comparing 30-year mortgage rates and 10-year Treasury yields from January through March 2023.


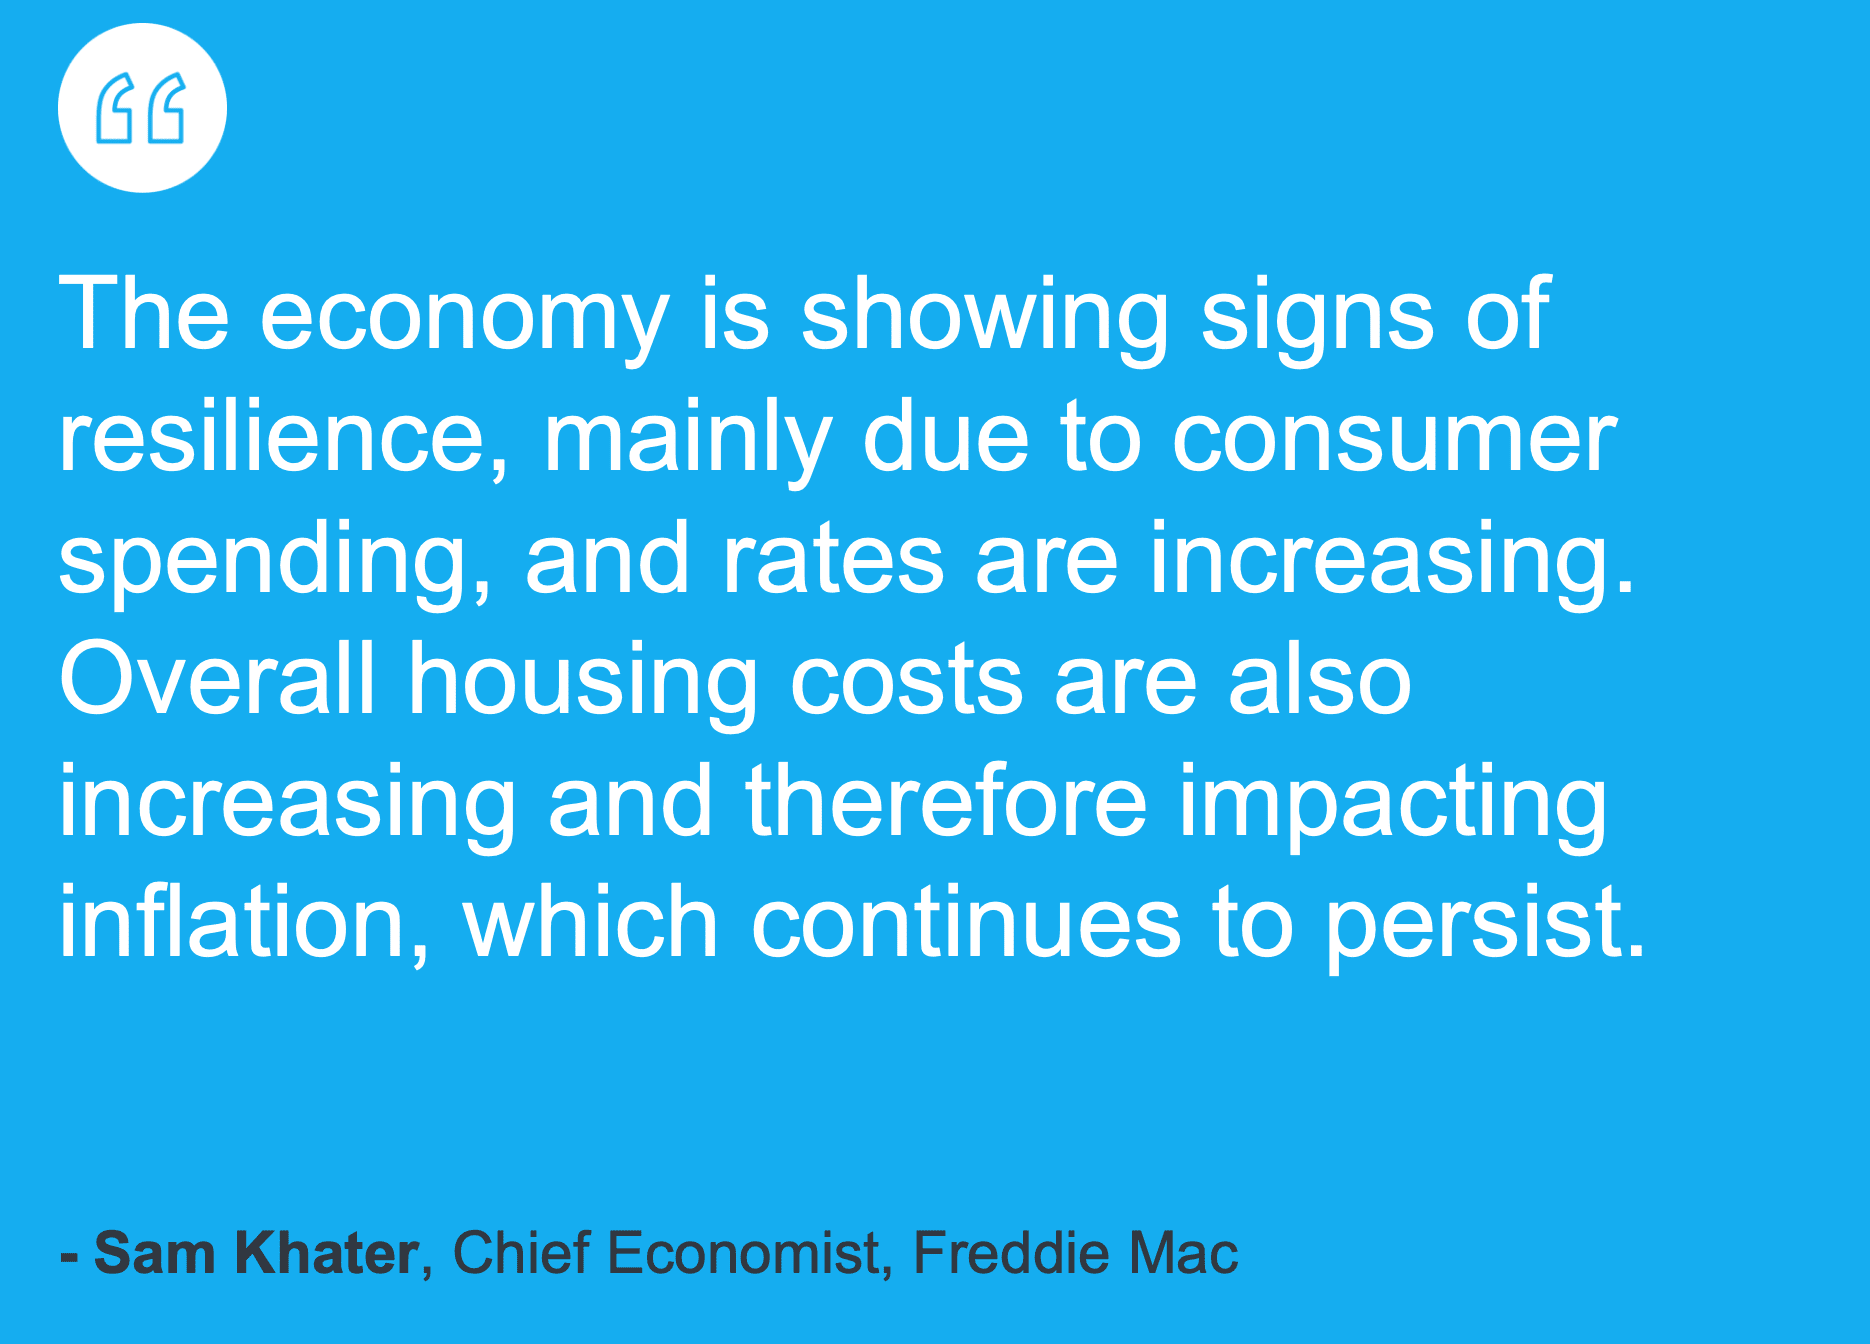
Sam Khater of Freddie Mac says the economy is resilient, while rising rates and housing costs continue to affect inflation.

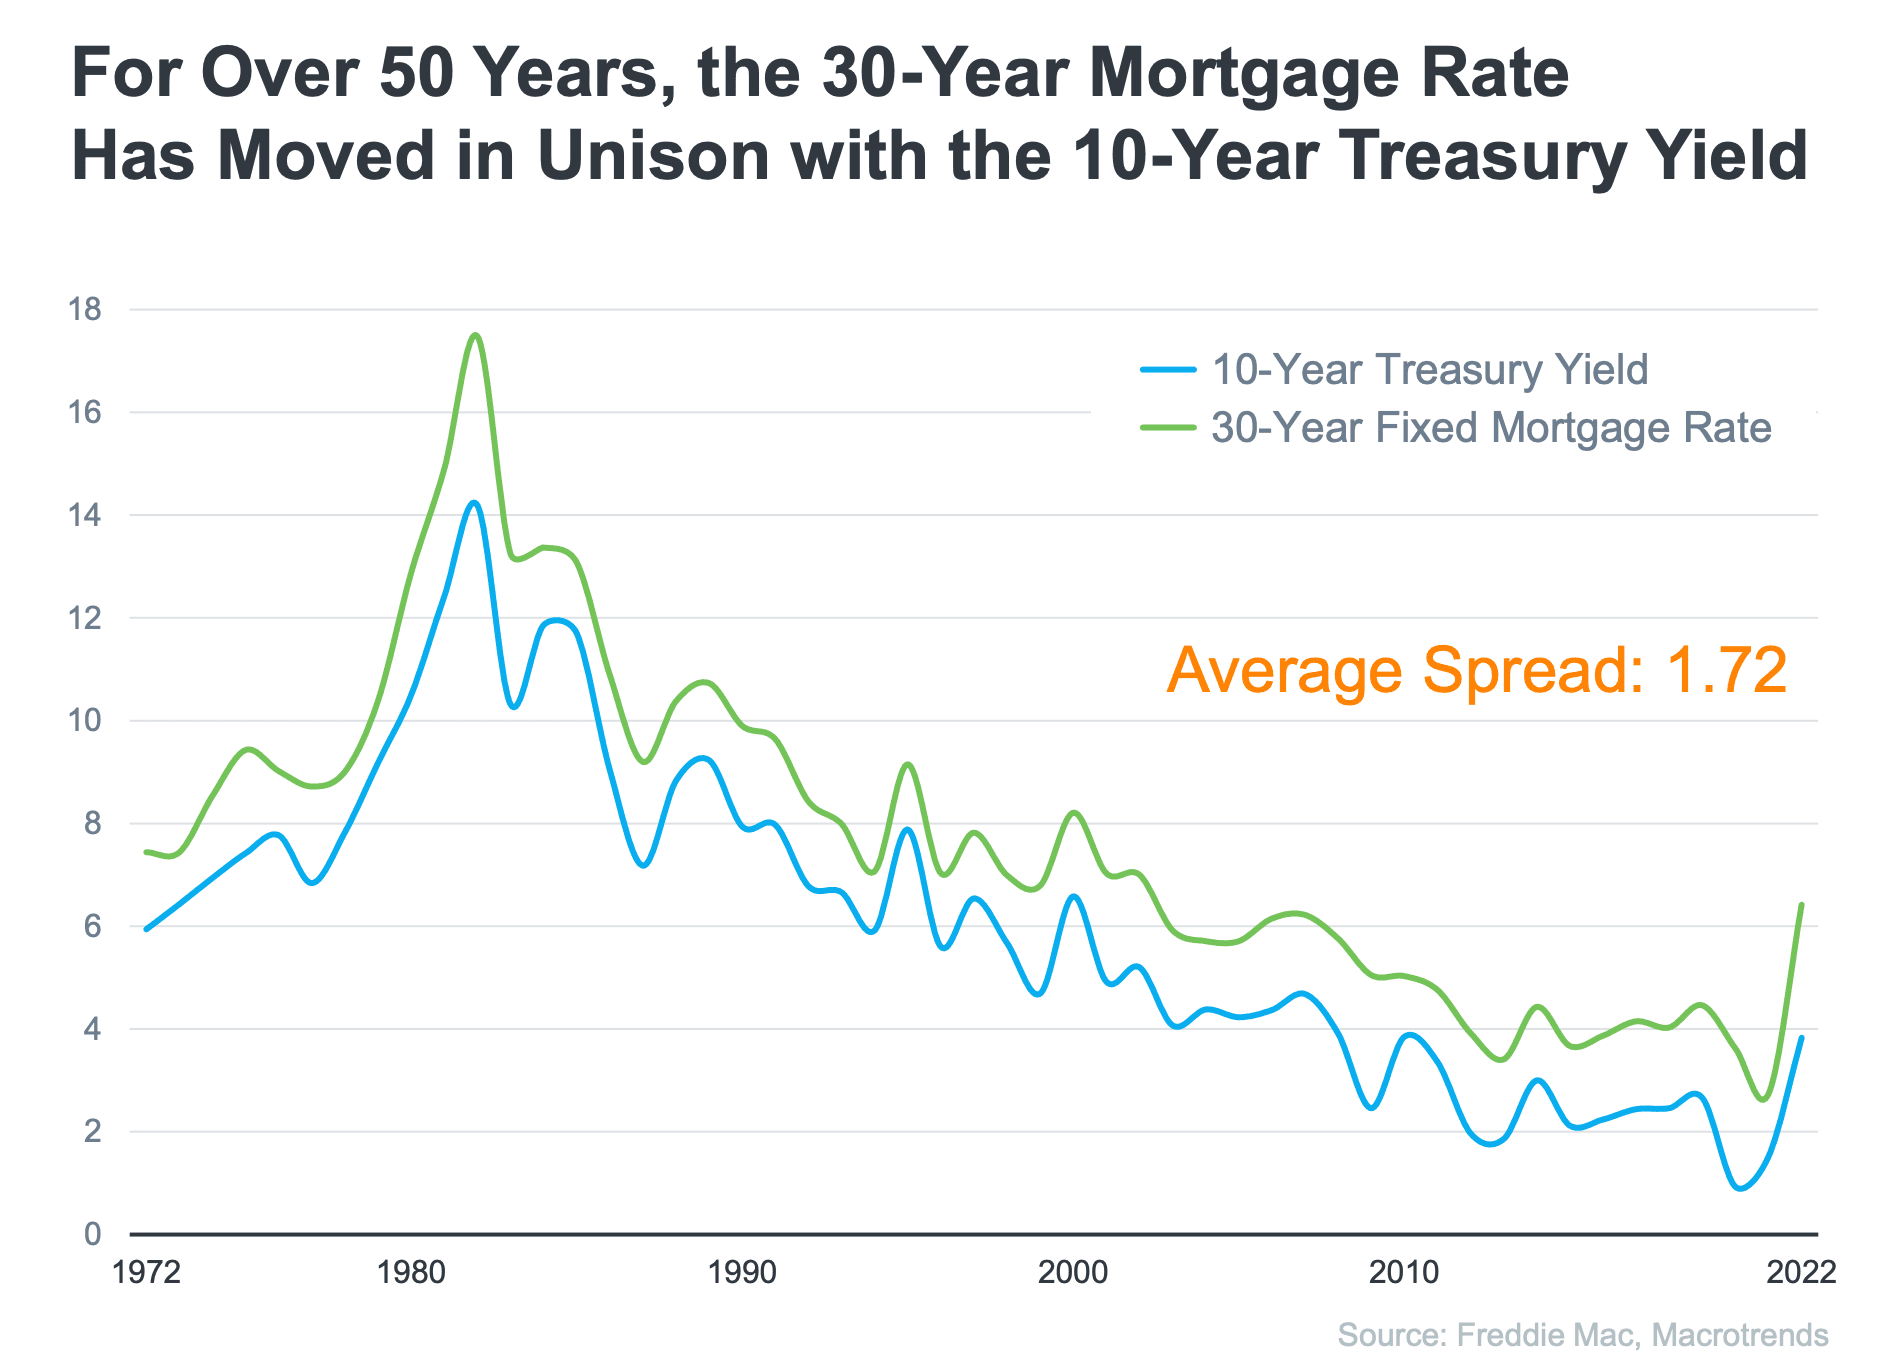
Line chart showing 30-year mortgage rates and 10-year Treasury yields moving in tandem from 1972 to 2022.

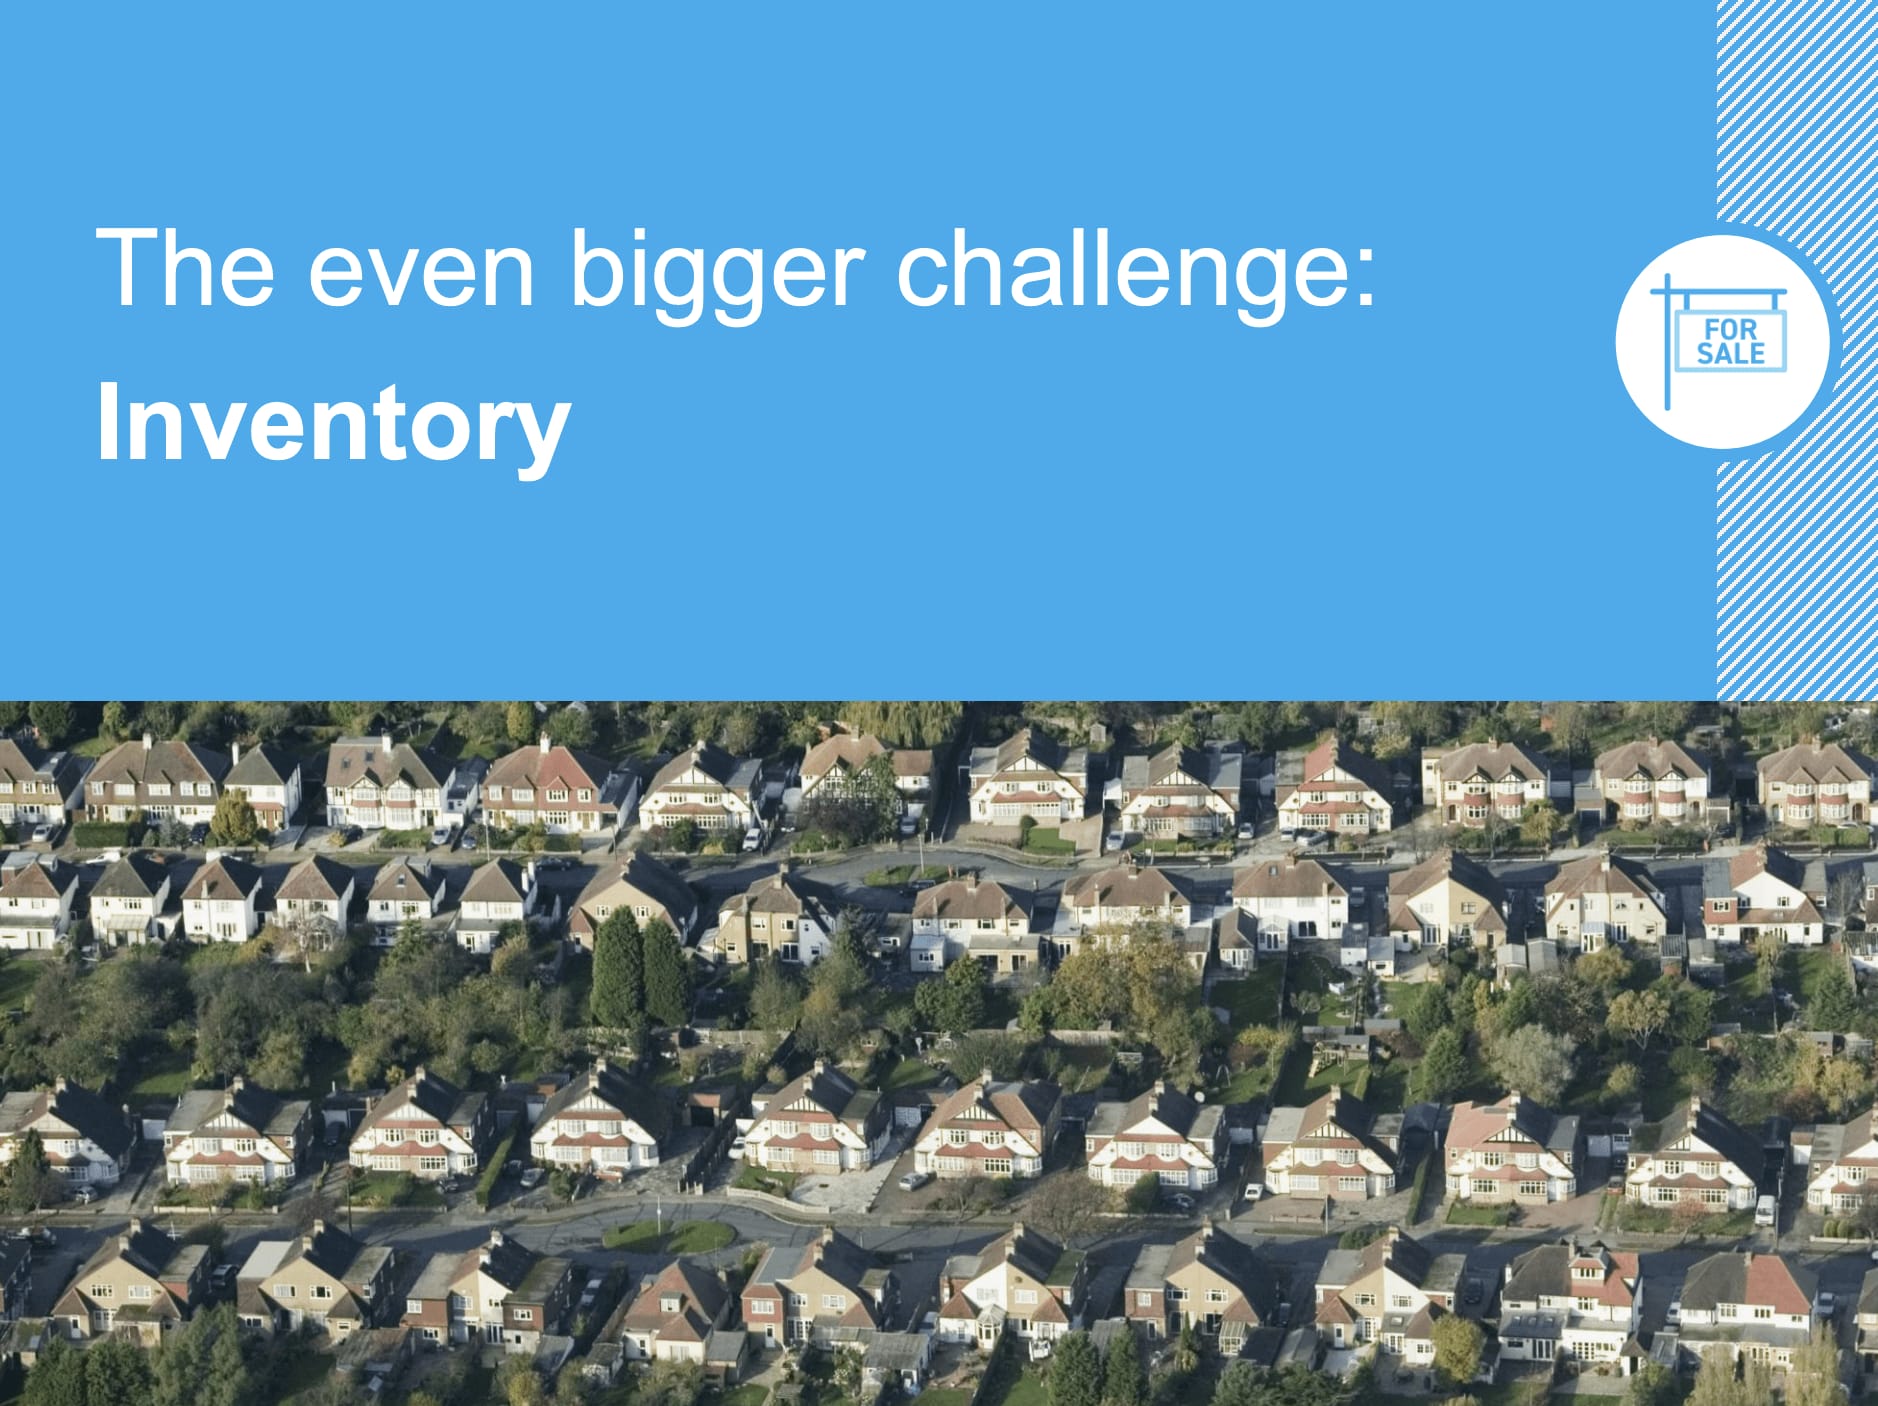
Market recap graphic highlights the inventory challenge above an aerial view of suburban homes.

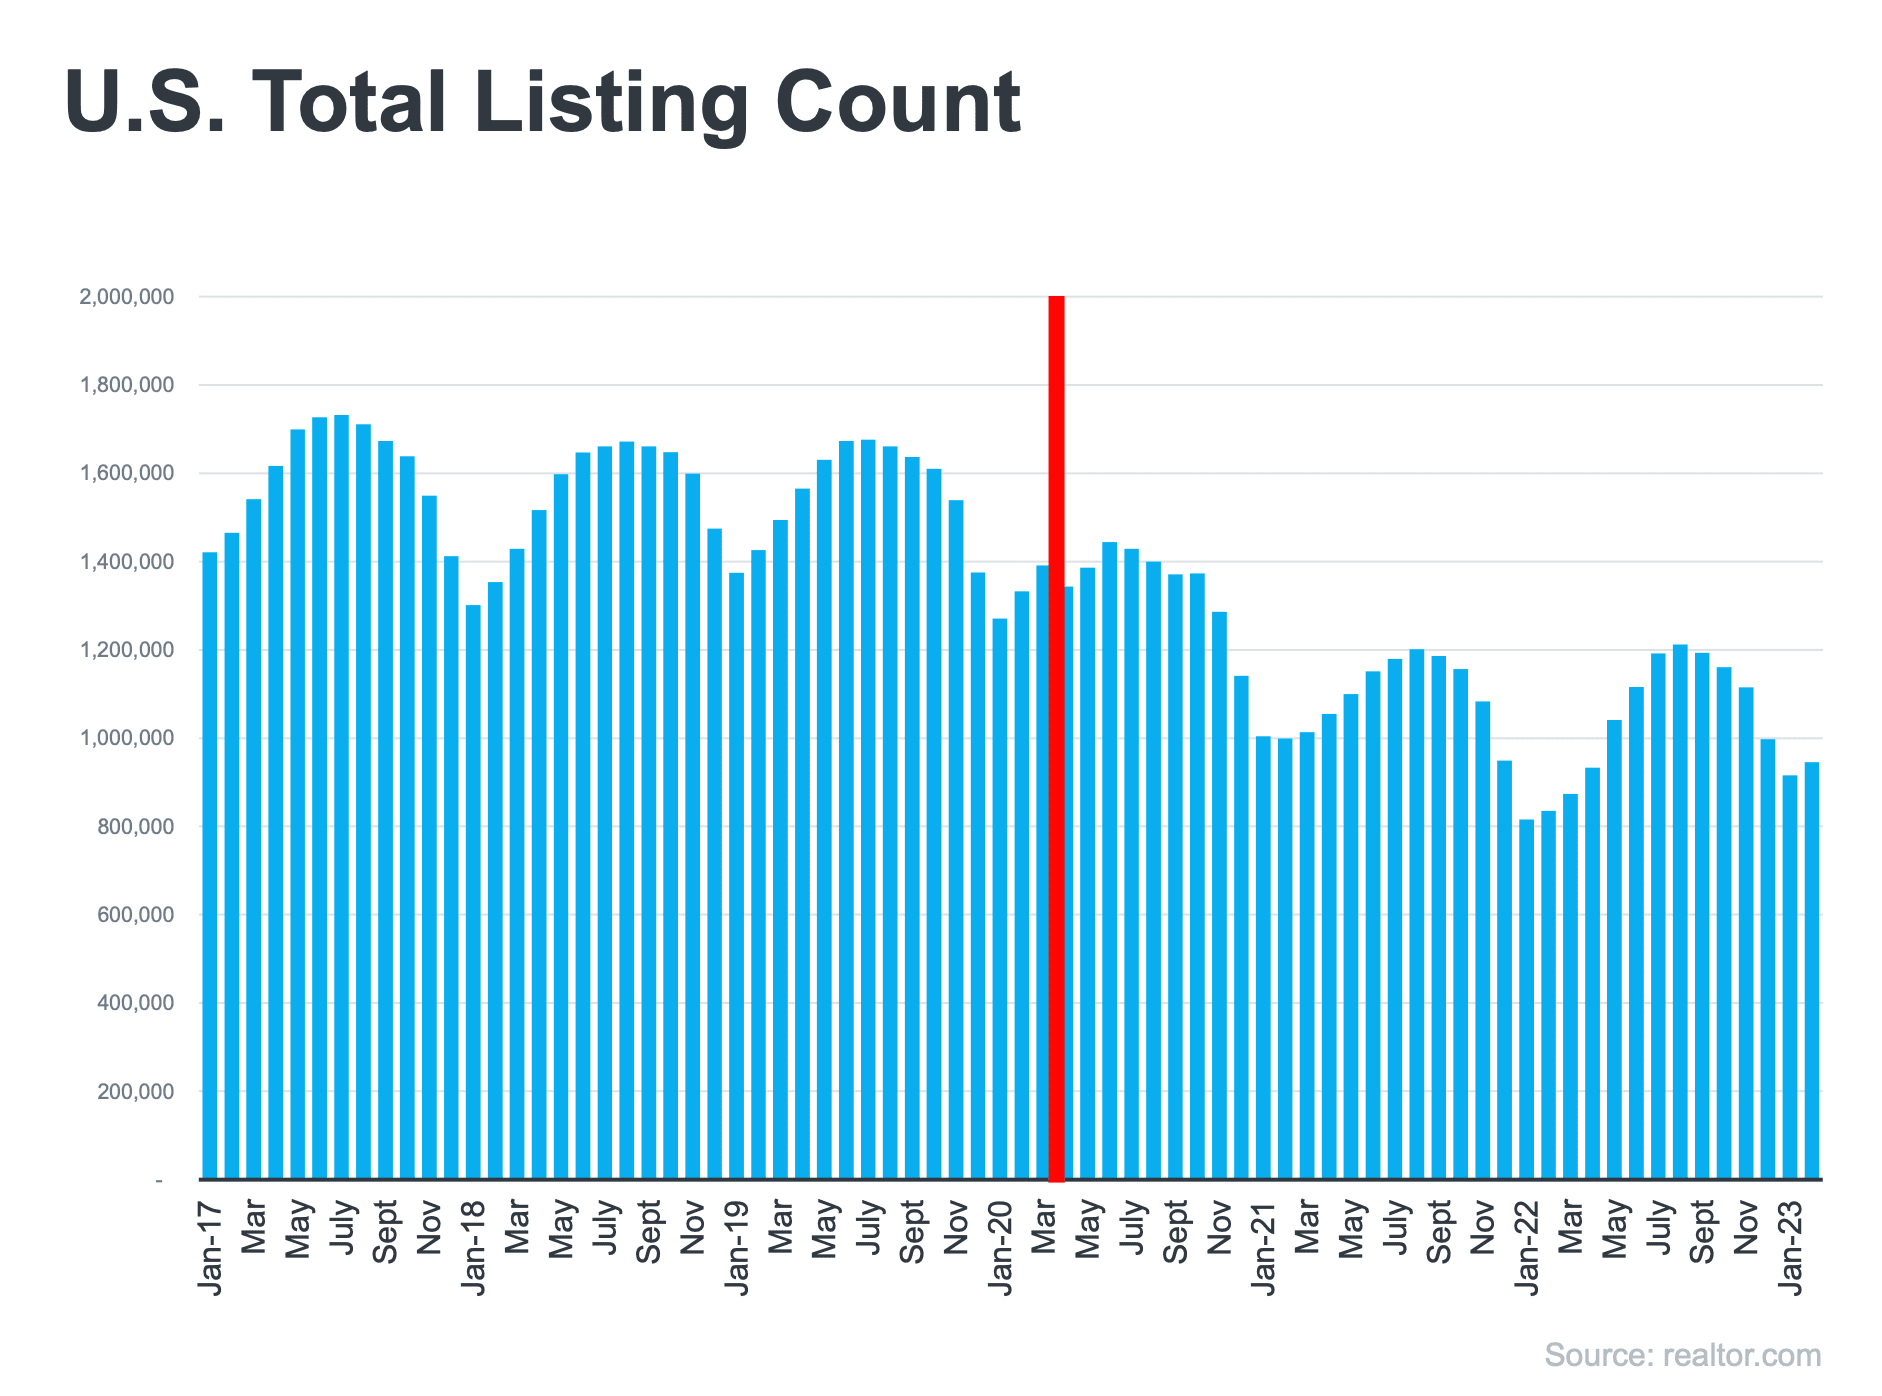
Bar chart of U.S. total listings, January 2017 to January 2023, with March 2020 highlighted in red.

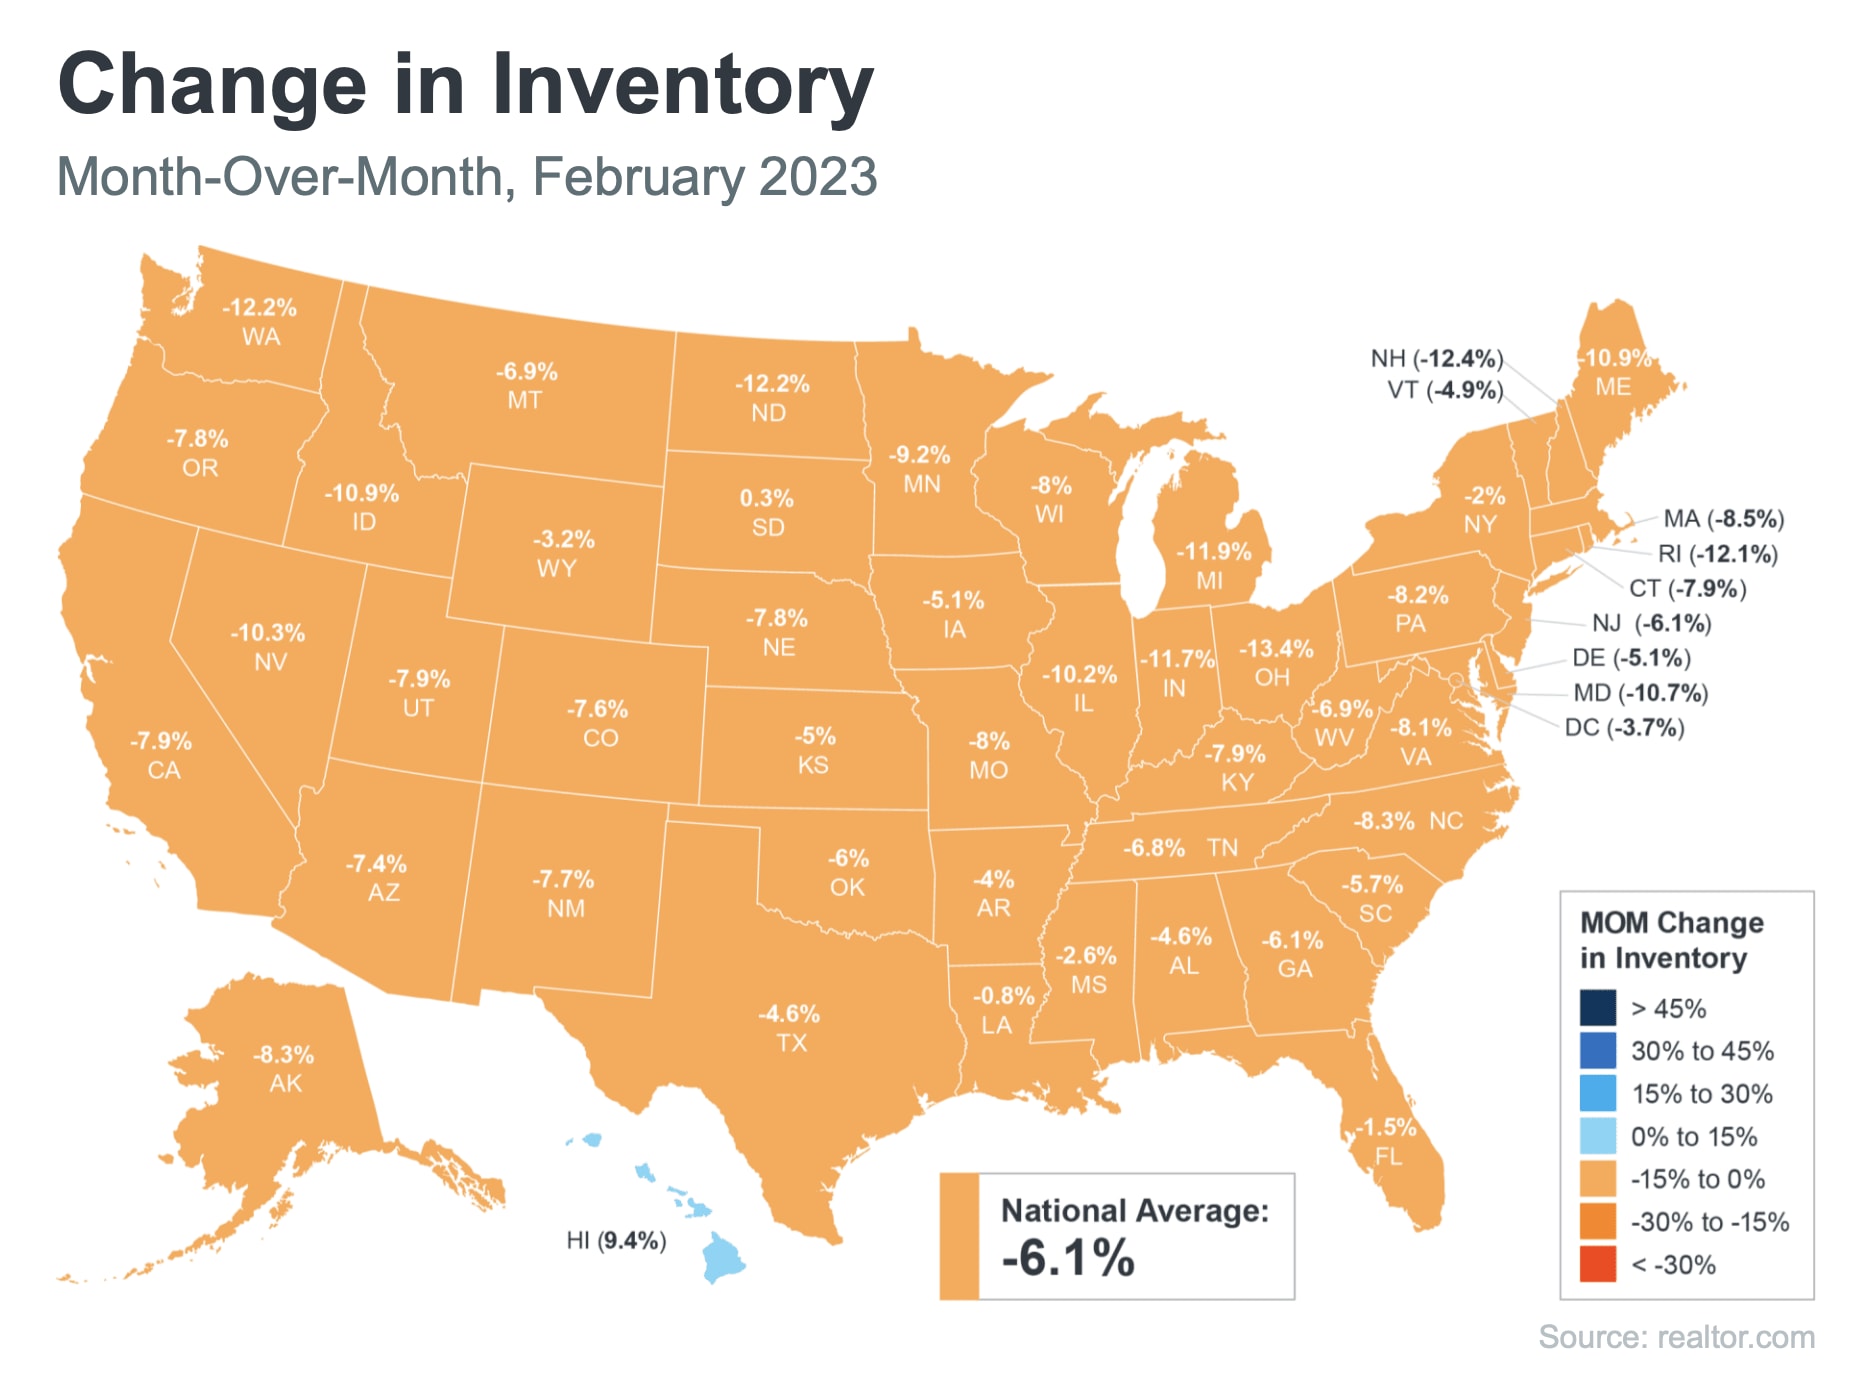
U.S. map of February 2023 month-over-month inventory changes by state; national average: -6.1%.


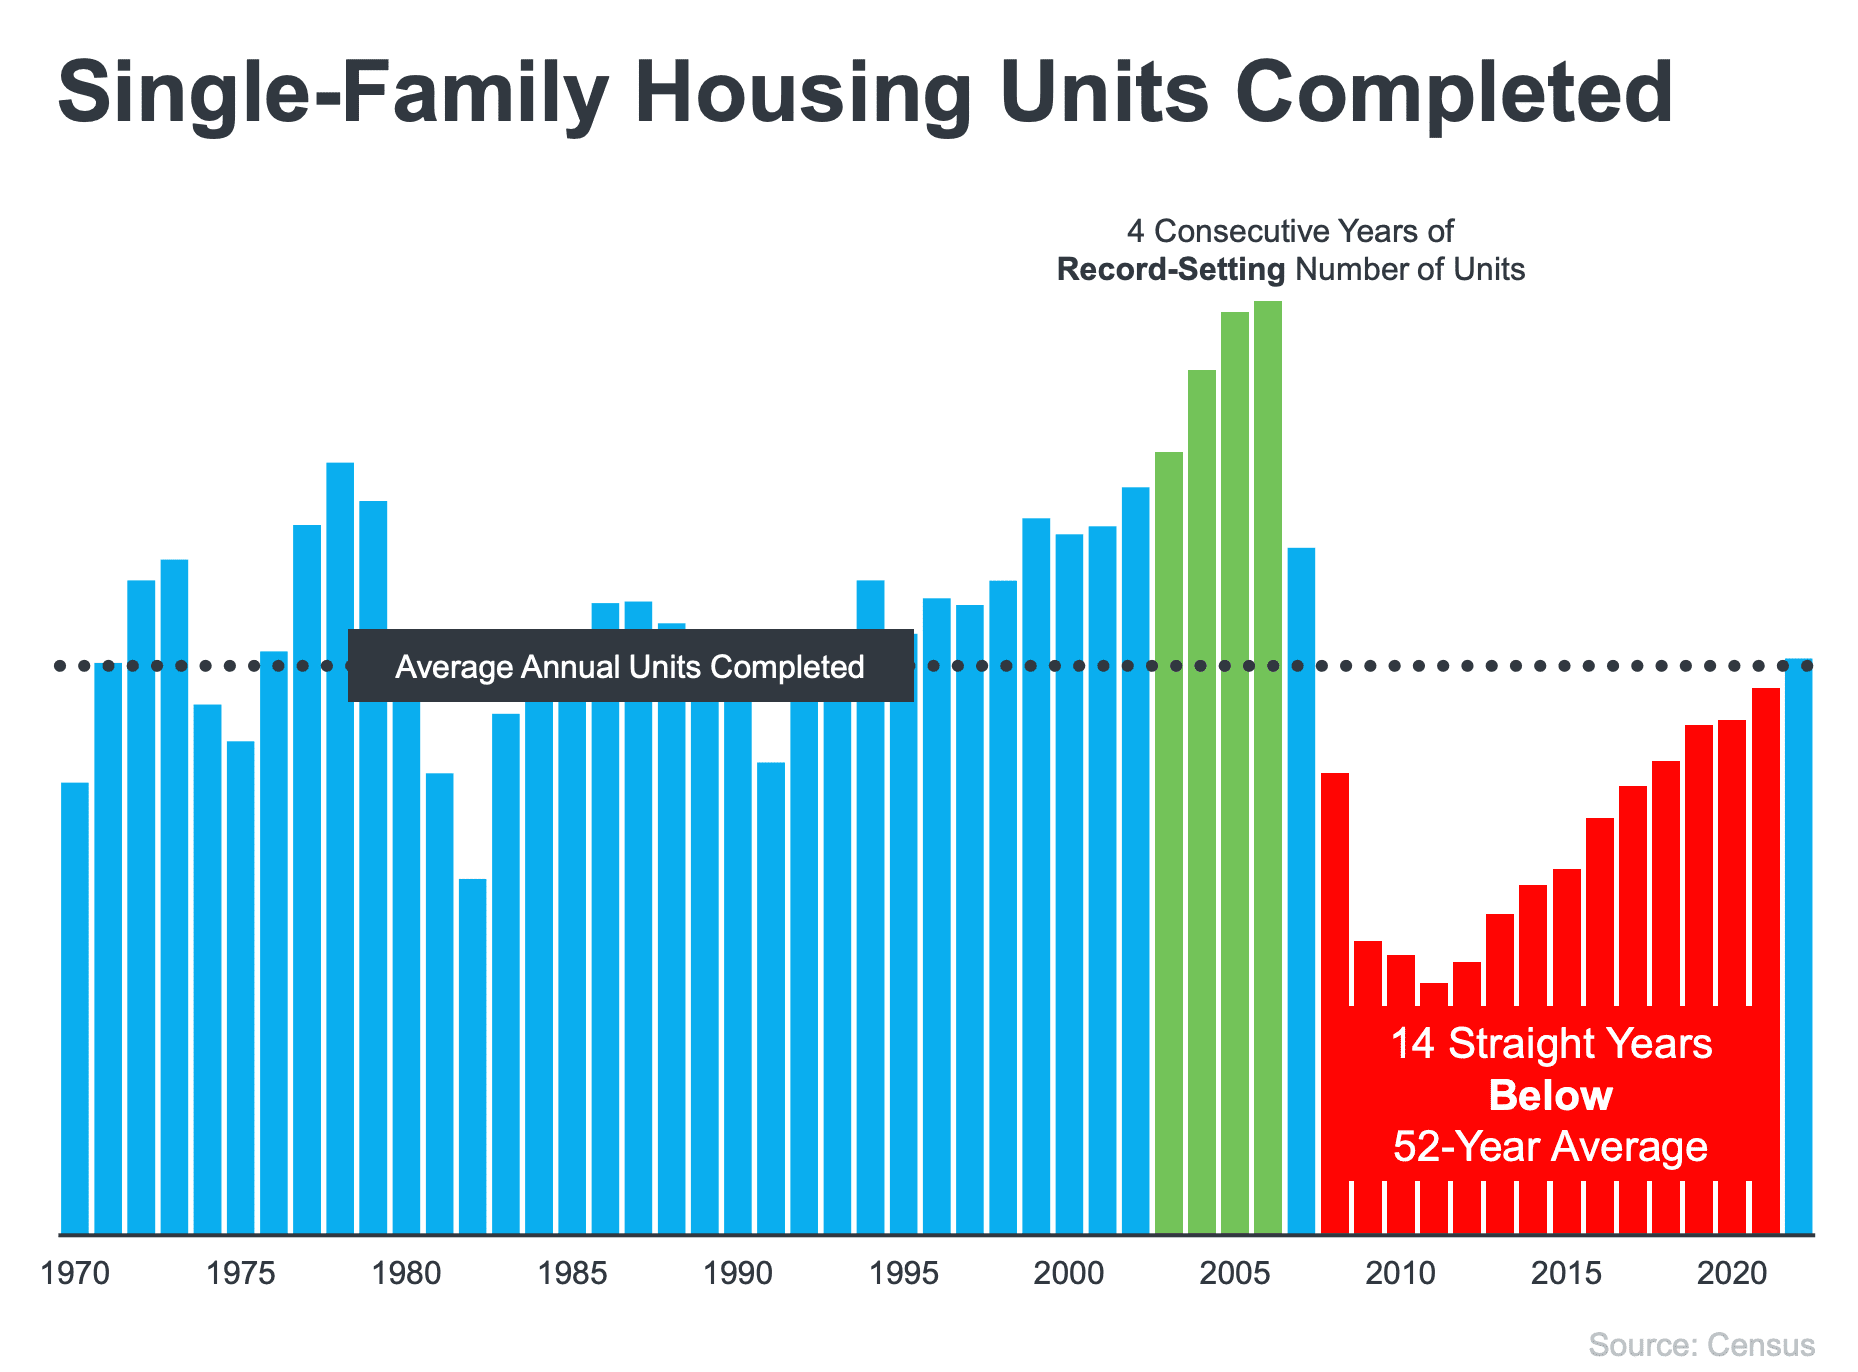
Bar chart of single-family housing units completed, highlighting four record-setting years and 14 years below average.

Glossy green and red buttons on silver bases, side by side.


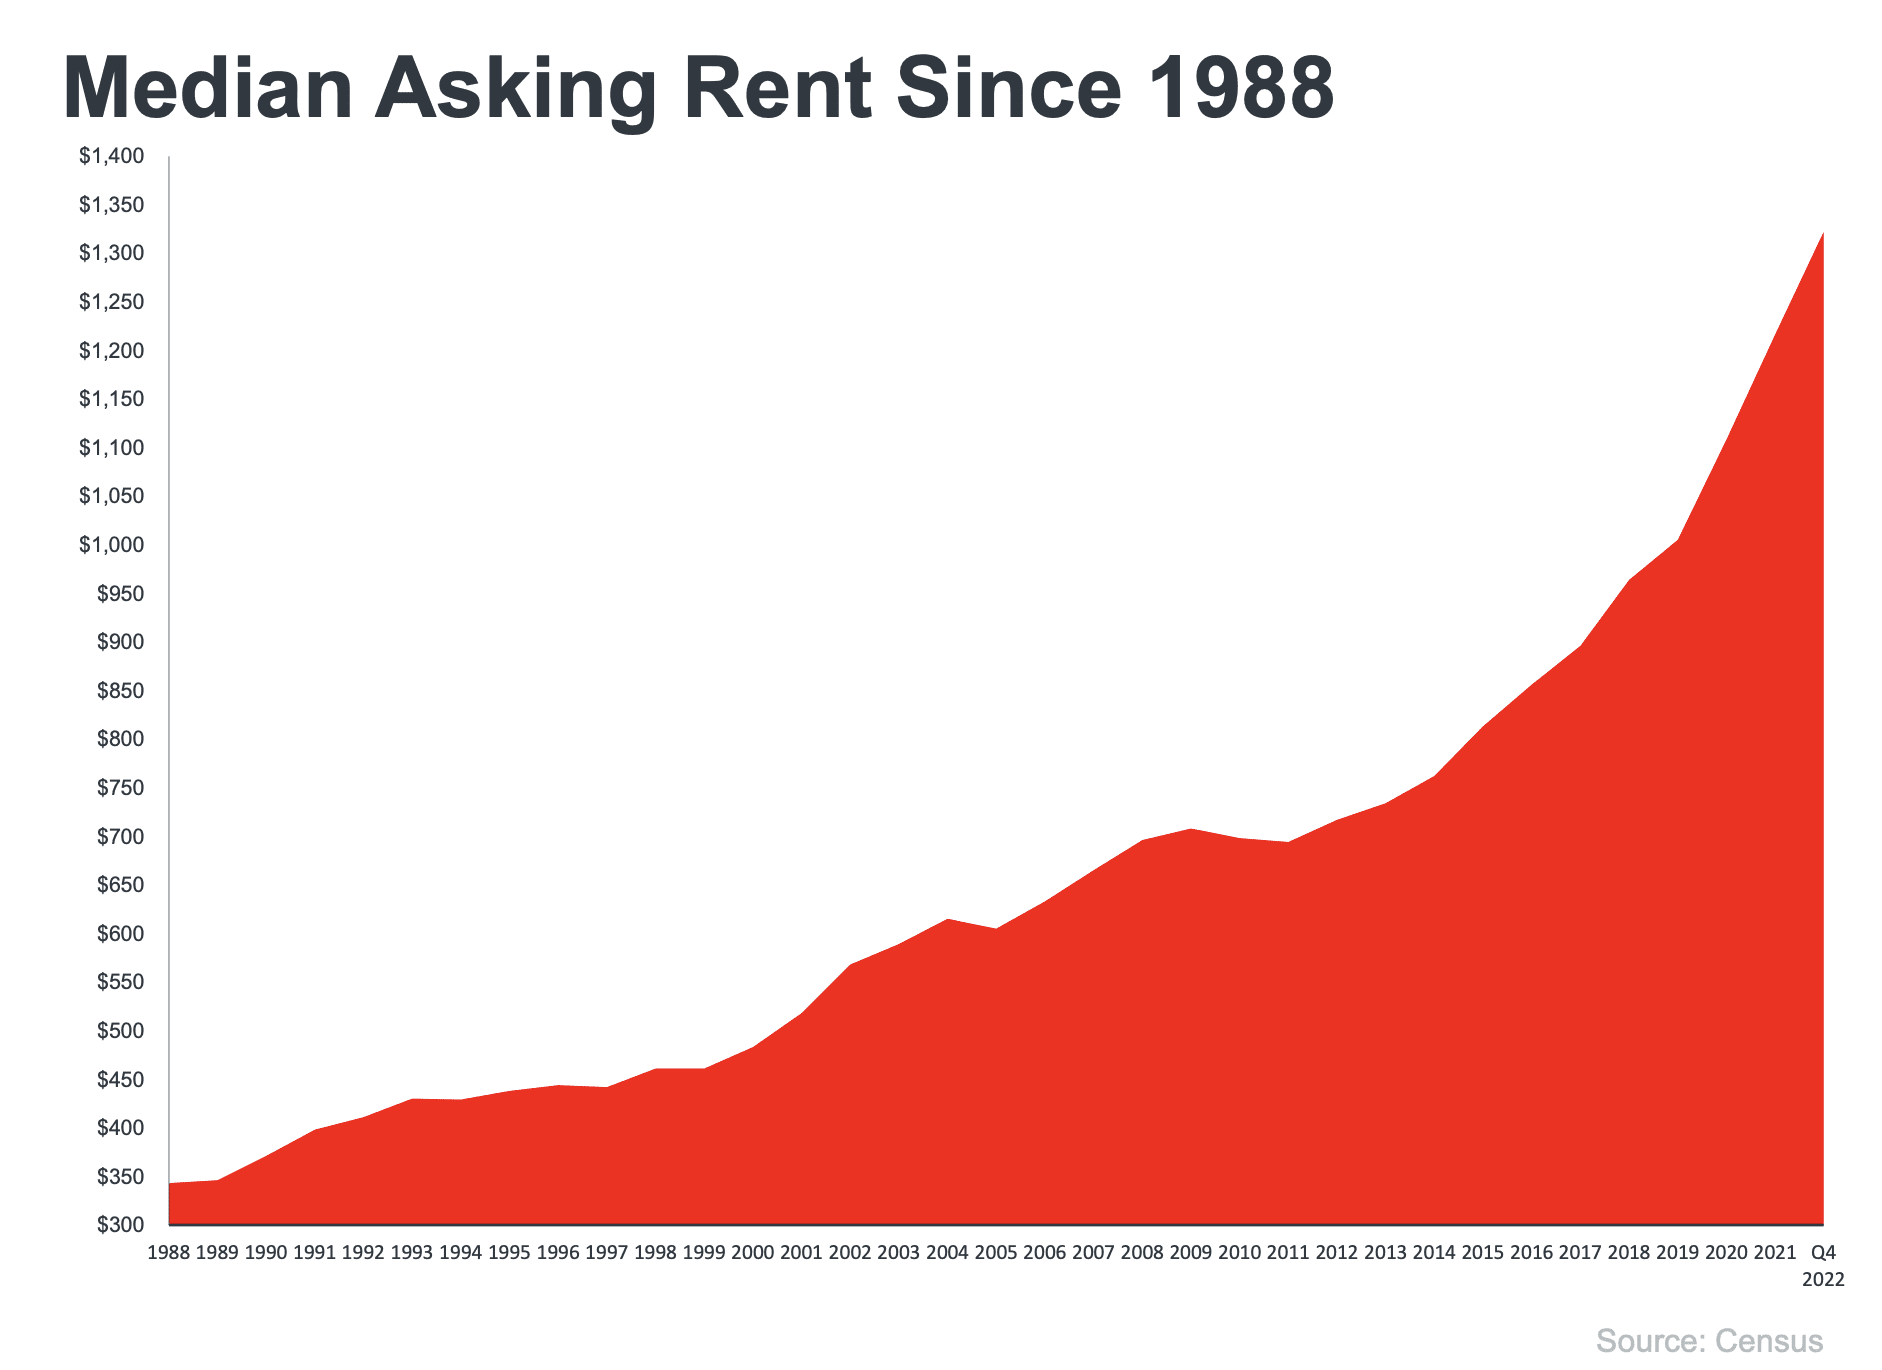
Chart of median asking rent rising from about $340 in 1988 to $1,320 in Q4 2022.

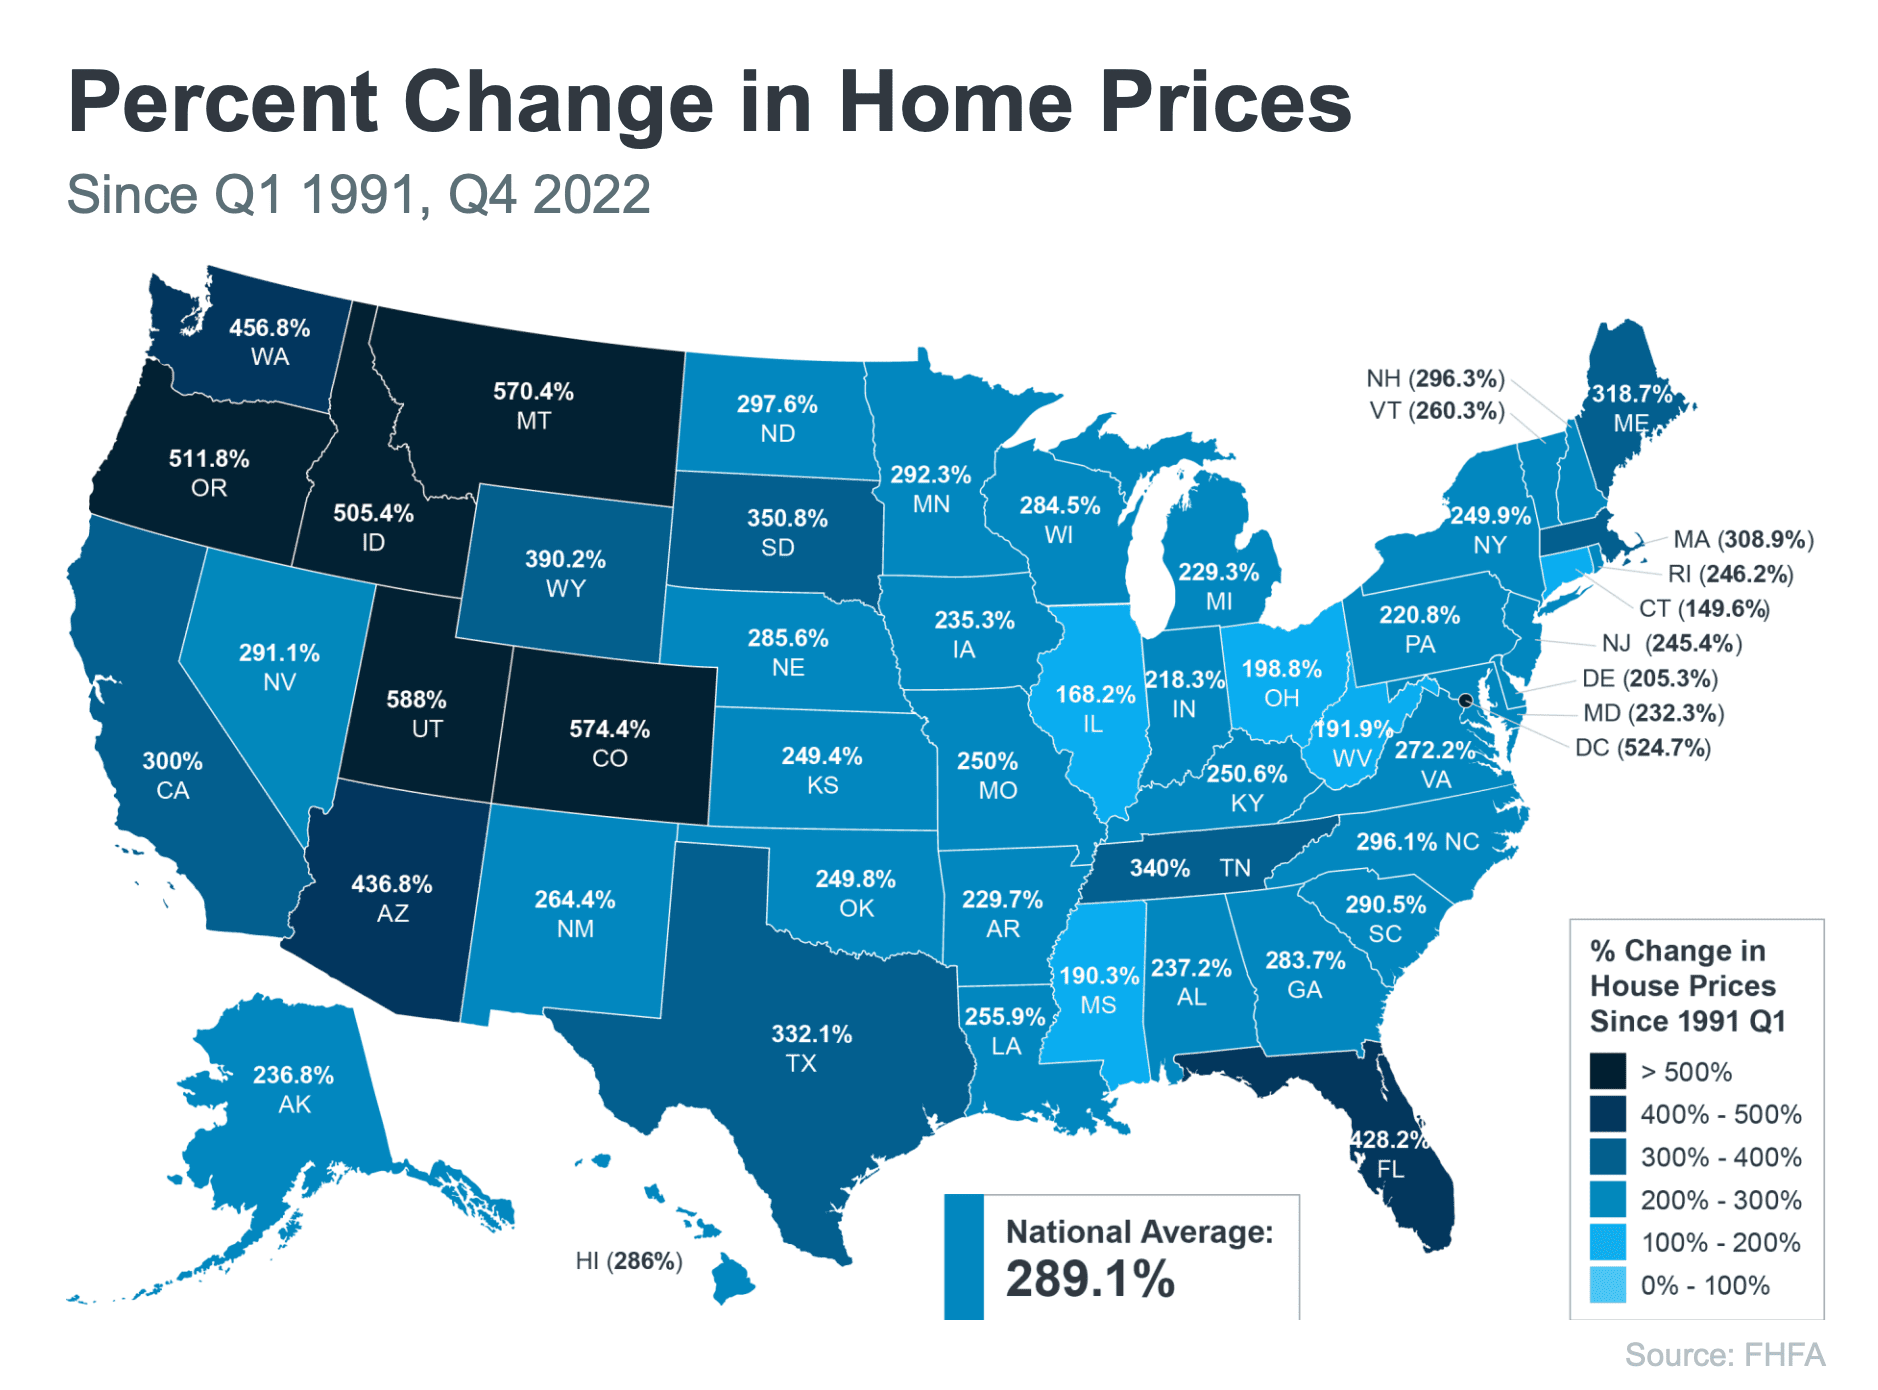
U.S. map infographic of home price increases by state since 1991, with a national average increase of 289.1%.


Dave Ramsey quote advising people to seek someone with the heart of a teacher for financial help.Dave Ramsey quote: seek someone with the heart of a teacher when getting financial help.


Work With Us

We have positioned ourselves as the “go to” agent for first time home-buyers, and it’s all due to our tenacity, trustworthiness, and experience.

CONTACT US